
We have estimated pedestrian traffic by street segment across the whole city of Bilbao with a simulation that recreates the day of every resident, person by person, each with their own activity schedule. We then tested it against 121 manual counts the model had never seen. Here is the result, how to read it, and what it makes possible.
The result: joint variation, order of magnitude and ranking
The simulation estimates pedestrian traffic on Bilbao’s ~30,000 street segments, hour by hour. Against the 121 manual counts:
- 0.81 correlation between simulated and counted traffic (R² = 0.65). None of the counts was used to calibrate the model. In other words, 65% of the variability observed across the 121 manual counts is explained by our simulation, which assigns a pedestrian traffic value to all 30,000 street segments in the city.
- No segment is off by an order of magnitude. In two out of three, the simulation falls between half and double the count: a moderate, evenly distributed error.
- The ranking of streets holds: the busiest streets in reality are the busiest in the simulation, and the same goes for the quietest.
This is what matters for decisions. There is no different policy for a street with 1,200 pedestrians a day and one with 2,000, even though the gap between them is 40%. There is one for a street with 200 people and one with 20,000. The simulation comfortably delivers that order of magnitude on every street segment of the city, including the thousands that have never been counted and never will be.
Two ways to simulate pedestrian traffic
At unica360 we work with two levels of mobility simulation, and it is worth telling them apart, because this case is the second one.
- microtarget: standard pedestrian and vehicle traffic with national coverage. Agents choose origin, destination and route based on trip generation and attraction data, as we explained in Agent-based human mobility simulation, now for everyone. It is an annual snapshot, ready to use, with wide coverage -whole countries-, low cost and a single, comparable methodology.
- Ad hoc activity-based simulation: for a district, a city or a metropolitan area, with location-specific data and higher precision. Narrowing the coverage lets us raise the quality of activity attractors, the attractiveness of each street segment, travel modes and interchange points -public transport ridership, for example-. This is the Bilbao case.
How an activity-based simulation is built
In an agent- and activity-based simulation, what gets modelled is people. Trips are the consequence of what each person has to do during the day, and every pass along a street segment keeps track of who made it and why. Each agent carries its own activity schedule, which is, of course, not random.
1. Every resident, an agent with a profile
Agents represent the people moving around the city, by quotas of sex, age, employment status and household, tied to their starting location at their home address.
2. An activity schedule for every agent
The main activities are work, study, shopping, leisure and care, with times and places. Schedules are built from the Time Use Survey of the Spanish National Statistics Institute (INE), which records the daily activities of 9,193 households and 19,295 people in its latest published edition.
3. Trips assigned to each street segment, hour by hour
Each agent carries out its schedule on the real street network. Their routes are aggregated by segment and by hour, and the result is the pedestrian traffic of every street throughout the day.
Validation: simulated pedestrian traffic vs. manual counts
A 0.81 out-of-sample correlation
We compared the simulated daily pedestrian traffic on each segment with 121 manual counts spread across Bilbao. Each count point was assigned to its street segment and the assignment was checked by hand. Matching a point to one or more segments is not trivial: it requires human judgement and it unquestionably affects the study. It is important to stress that none of these counts was involved in calibrating the simulation: this is an independent, out-of-sample validation.
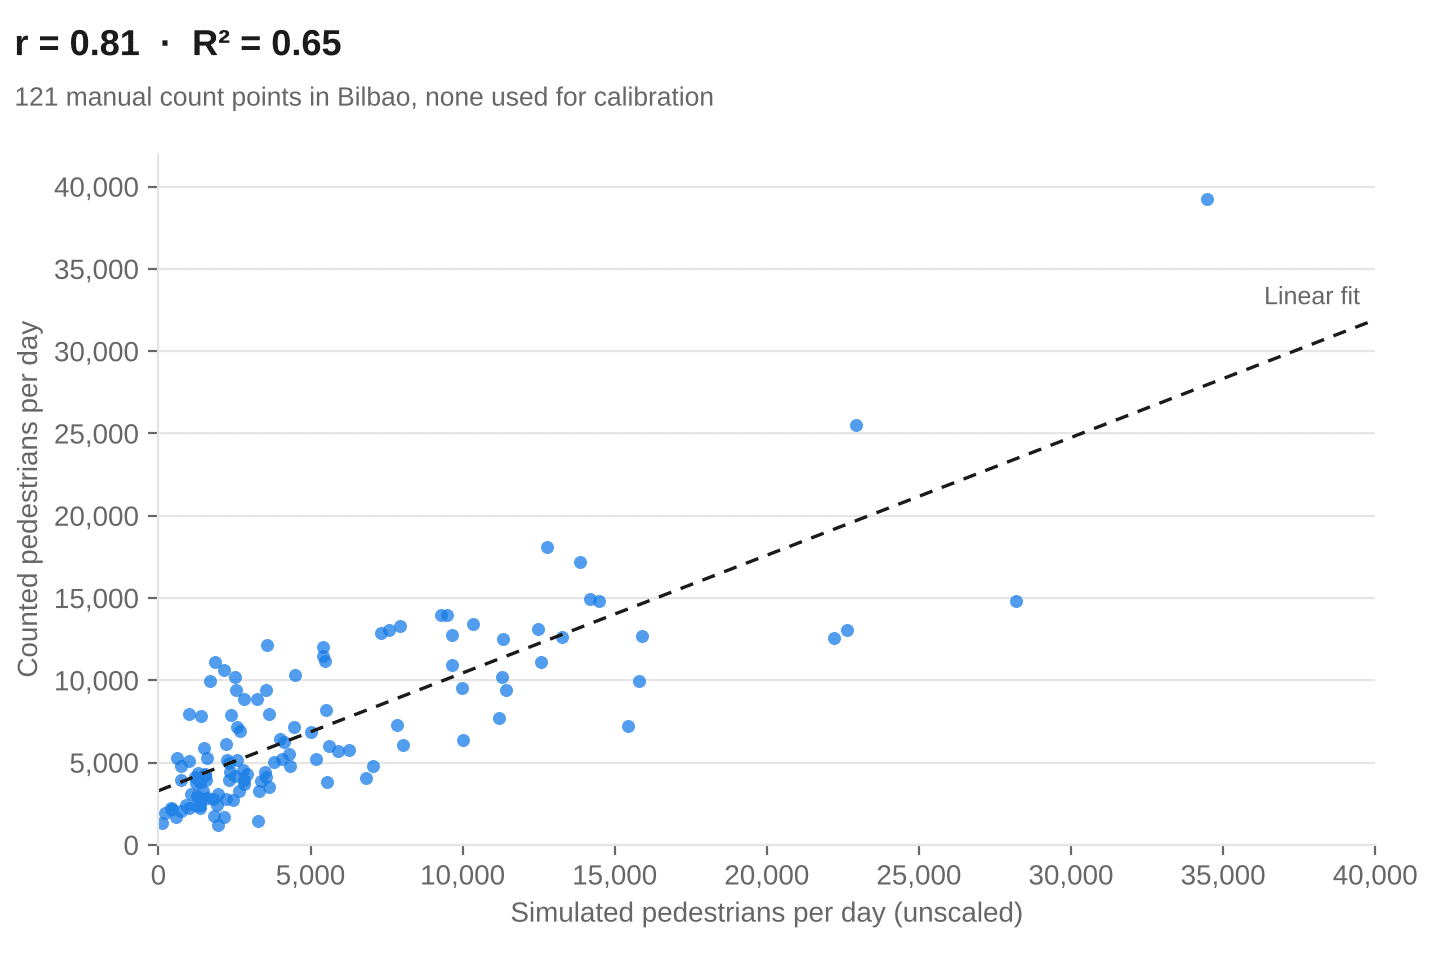
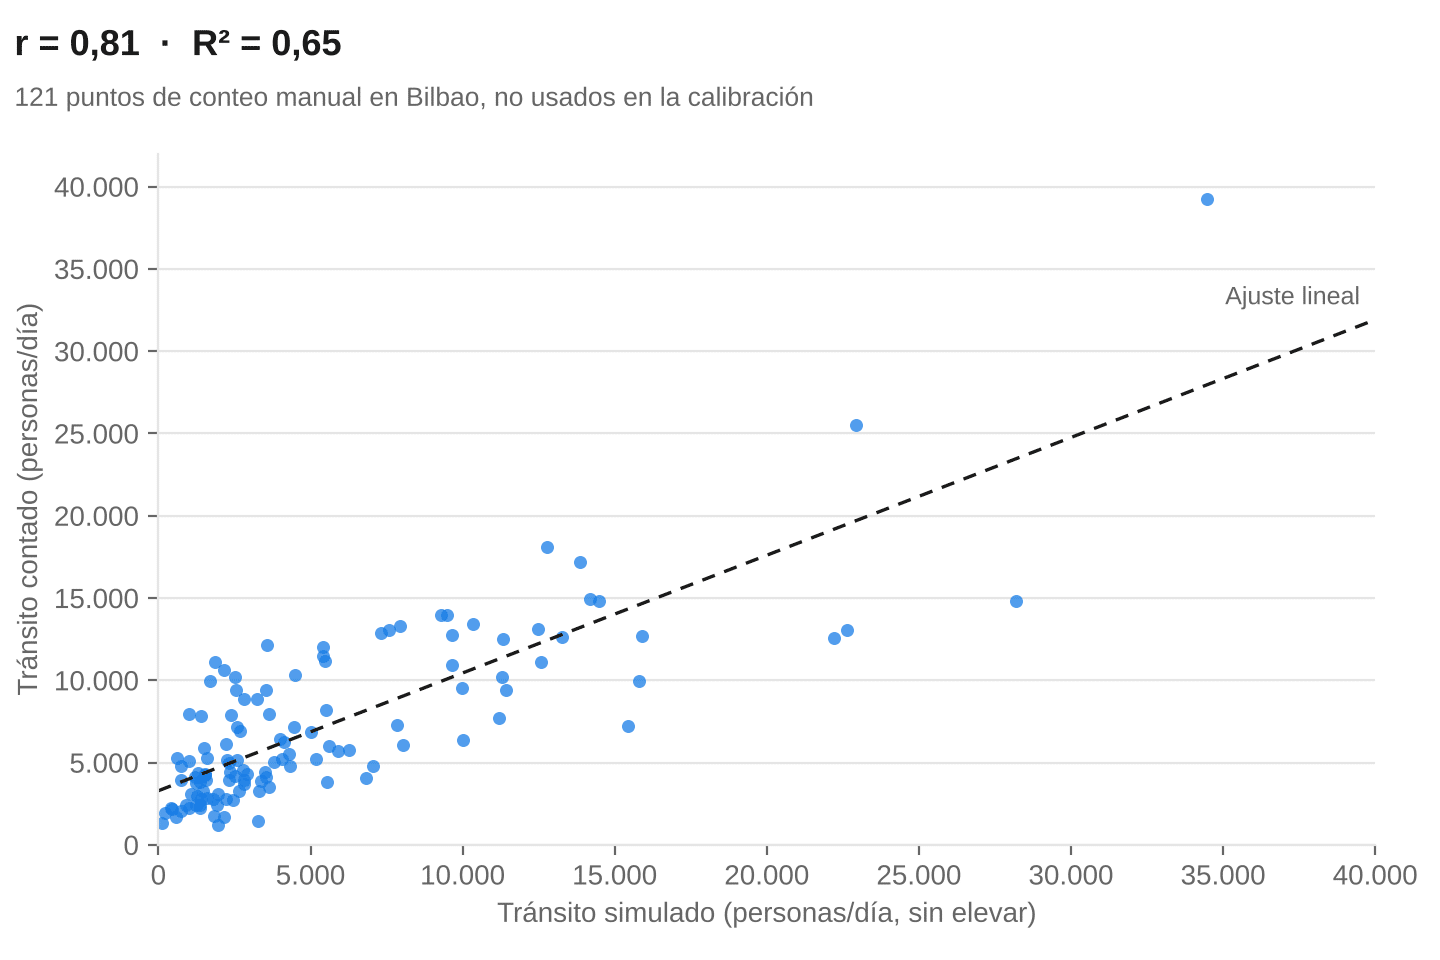
A 0.81 correlation means the simulation explains 65% of the variation in traffic between points. Of what makes one street different from another in number of pedestrians, two thirds is reproduced by a model that never saw the counts. The rank correlation (Spearman) is 0.75: the ranking of streets holds even without leaning on the busiest ones.
Is 0.81 a lot? Yes. Here are some references
There is no standard threshold for validating city-scale pedestrian models. What there is, is a distinction that changes how any figure should be read: whether the model is evaluated on the same counts it was built with (in-sample) or on counts it has not seen (out-of-sample).
Schneider et al., with UC Berkeley and San Francisco’s transport agencies, built a regression that estimates annual pedestrian crossings at each intersection from six variables: households and jobs within roughly 400 metres, metered parking zone, slope, traffic signal and proximity to a university campus. They fitted it on counts from 50 intersections.
- In-sample, on those 50 intersections, the adjusted R² is 0.80. That is the figure usually quoted.
- Out-of-sample, on counts from another 49 intersections, the correlation drops to 0.39.
The drop is not a flaw in the study: a regression fitted on a few points also learns their quirks, and those do not carry over to new points. Our 0.81 is of the second kind, so the fair comparison is not with San Francisco’s 0.80 but with its 0.39. Other published figures, with methodological differences that rule out decimal-level comparison:
| Study | City and points | Model | Fit against counts | Out-of-sample? |
|---|---|---|---|---|
| Jiang | London, 4 areas, 33–67 points per area | Space syntax and street ranking | R² 0.38–0.70 by area | Yes |
| Jiang and Jia | London, same areas | Agents on the street network | mean r 0.63–0.76 by agent type | Yes |
| Hankey and Lindsey | Minneapolis | Direct demand (regression) | R² 0.50 | No |
| Schneider et al. | San Francisco, 50 intersections | Direct demand (regression) | Adjusted R² 0.80 | No |
| Schneider et al. | San Francisco, 49 new intersections | Same model | r = 0.39 | Yes |
| unica360 | Bilbao, 121 points | Activity-based agents | r = 0.81; R² 0.65 | Yes |
The comparison is clear: unica360’s agent- and activity-based simulation outperforms every result in the benchmark. The most likely reason is not the simulation or routing code, but the quality of the data the simulation runs on, after many years of working with it:
- high-precision estimates of the resident population
- workplaces and number of workers
- tourist attraction and visitor flows
- points of attraction: shopping, personal services, food and drink, leisure, health…
- in-depth work on street attributes in the topology of the walkable network
How far off it is on each segment, and why that is little, very little
The correlation already tells us the simulation ranks segments well. To see how far it deviates on each one, we bring it to the scale of the counts with a single global factor, with no other adjustment:
- On half of the segments, the difference from the count is less than 40%.
- On two out of three, the simulation falls between half and double the count.
- On almost nine out of ten, within a factor of 3.
- On none does the difference reach an order of magnitude.
A 40% gap may sound large in the abstract. On the street, it is not: between 1,200 and 2,000 pedestrians a day there is a 40% difference, and no urban planning, retail or mobility decision treats those two streets differently. What changes a decision is knowing whether 200 or 20,000 people walk along a segment, and on that the simulation does not fail at any of the points tested. Because the error between prediction and count ranges from 0 to infinity, not from 0 to 100.
The largest errors follow two clear patterns: the simulation overestimates some very busy corridors and underestimates some quiet streets. It spreads streets apart a little more than reality does, and that is our next area of improvement, which in turn has to do with the quality of the simulation’s source data.
Why a manual pedestrian count is not the absolute truth
Every validation compares a model with a reference, and here the reference is not the truth. The Bilbao counts are 20-minute sessions, with a sampling design built to be representative, scaled up to a full day. It is the best reference available, but a 20-minute session does not capture how a street changes between hours, days and seasons. Part of the gap between simulation and count belongs to the count.
The alternative, measuring for real, is not viable. Counting pedestrian traffic on one segment 24 hours a day, on weekdays and weekends, in winter and in summer, is already expensive for a single point. Doing it on the ~30,000 street segments of a city like Bilbao is unaffordable. That is why counts serve the purpose they serve: to validate and to anchor. Pedestrian traffic by street segment, across the whole network and at every hour, can only be obtained by estimating it. This is the reality: nobody knows how many people walk along each street segment of a city.
Beyond volume: who walks along the segment, and why
The activity-based simulation does not just estimate the number of pedestrians. It tells you who they are, what they are like, and with what purpose -to carry out which activity- they walk along each segment, because every pass comes from an agent with a profile and a schedule.
Hourly distribution of pedestrian traffic
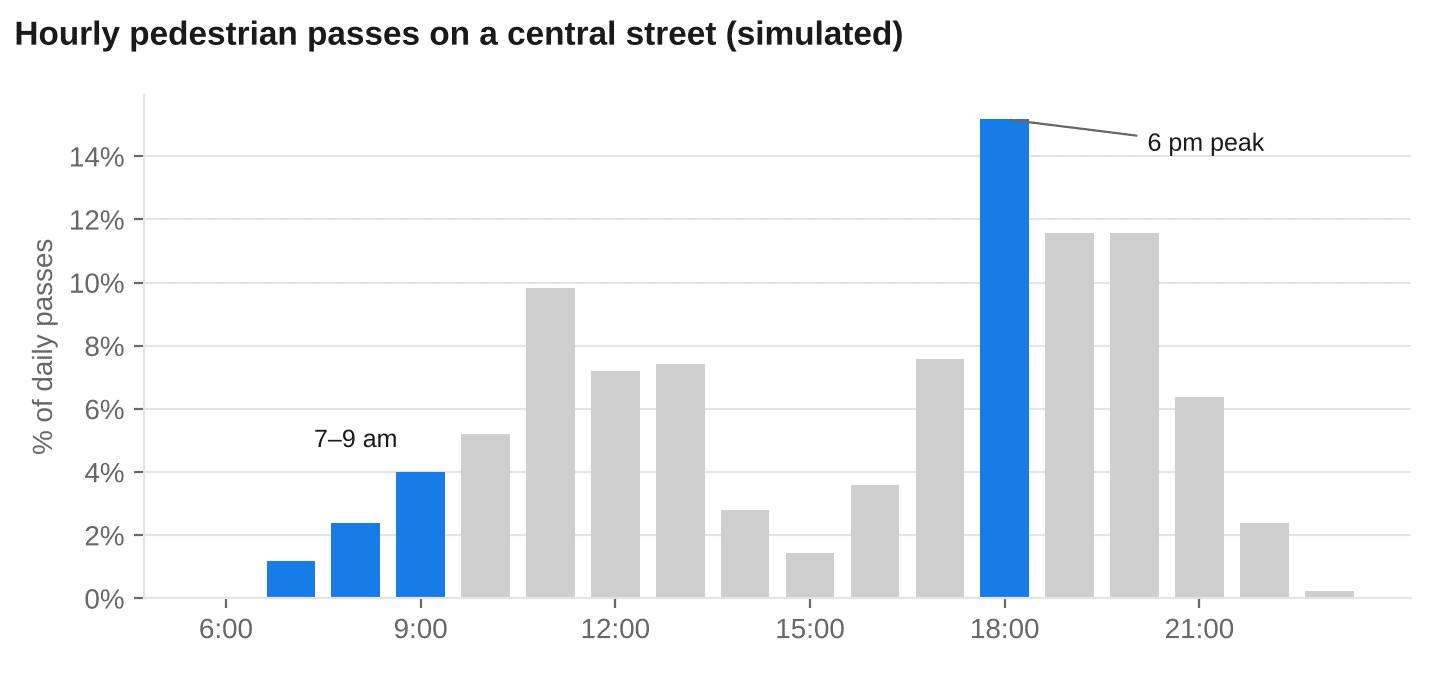
On a central street in Bilbao, pedestrian traffic grows until mid-morning, dips in the early afternoon and peaks at 6 pm, which accounts for 15% of the day’s passes.
Trip purpose and who walks by
At 7–9 am and at 6 pm, the same street is walked by different people for different reasons.
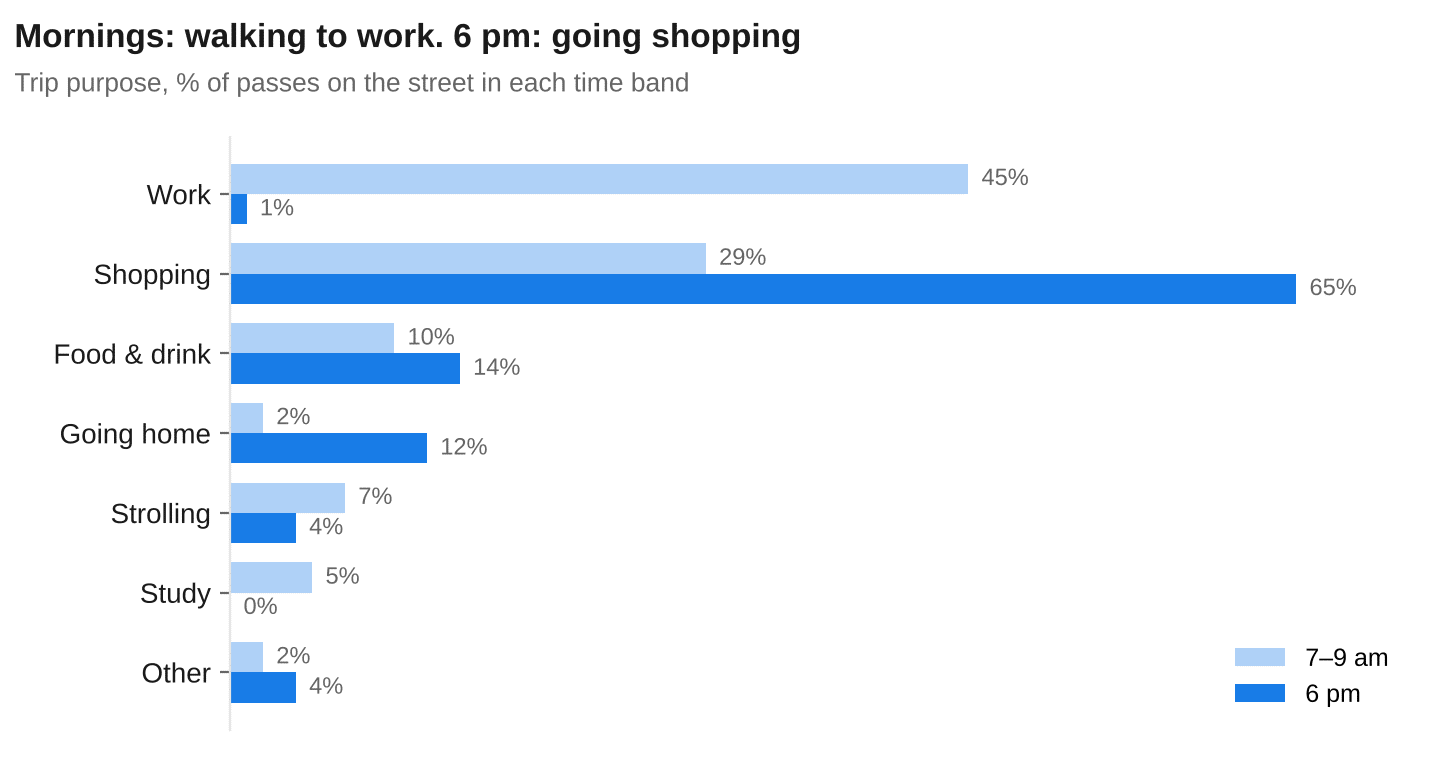
The profile changes too. Between 7 and 9 am, 80% of passers-by are employed (61% men, 19% women). At 6 pm, the two largest groups are women who are homemakers (27%) and employed men (23%). For a shop, an outdoor advertising campaign or a municipal service, these are two different audiences on the same street, two different times of the same day.
What pedestrian traffic by street segment is used for
Urban planning and mobility
Pedestrianising a corridor, removing a lane or moving a bus stop: the simulation compares the current scenario with the proposed one before anything is built, and tells you who each change affects, not just how many.
Public investment
Pavements, lighting, accessibility or street cleaning can be prioritised by number and type of beneficiaries: a segment used by workers early in the morning is not the same as one walked every day by older people or children on their way to school.
Road safety and environment
Pedestrian traffic by segment provides the exposure needed to interpret pedestrian collisions or noise and pollution levels: how many people, of what age and at what time, pass through the most critical spots.
Retail and services
For a store, who walks by and when matters, not just how many: a street people cross on their way to work early in the morning is no use to a shop that opens at 10. Profile and trip purpose by hour improve site selection for shops, restaurants, gyms or EV charging points, as well as sales forecasting models.
Outdoor advertising
Beyond the audience of each billboard by day and time band, the profile of passers-by makes it possible to measure affinity: how many impressions reach the campaign’s target audience.
If you need national coverage and a standard dataset, the simulated traffic in microtarget is the starting point. If you are working on a city or a metropolitan area and need high precision, explanation and evidence of accuracy, ad hoc activity-based simulation is the tool. If you have your own counts, we will test them against the simulation and show you the result, segment by segment: contact us.
Sources
- INE, Time Use Survey, methodology (in Spanish).
- Jiang, B., Ranking spaces for predicting human movement in an urban environment.
- Jiang, B. and Jia, T., Agent-based simulation of human movement shaped by the underlying street structure.
- Schneider, R. et al., San Francisco Pedestrian Intersection Volume Model.
- Hankey, S. and Lindsey, G. (2016), cited in Journal of Transport and Land Use.
