
Accurately estimating the population and sociodemographics for small areas, such as a 100-meter geographical grid, is a complex task that requires the integration of a variety of open data sources, spatial analytics tecniques and computational capabilities.
In this post, we will shortly describe the step-by-step process of estimating population at this high accurate spatial level.
The methodology heavily depends on the types and quality of available data sources. Specifically, it is crucial that, in the country where we are estimating population for small areas, there are accessible cadaster data as open data. The existence of data about cadaster properties, buildings, and dwellings within them greatly facilitates the distribution of population in those dwellings. This is the case in Spain, for example, where it is fairly easy to model the population per building accurately and then upscale it to a 100-meter grid.
However, there are many countries, even within areas with considerable development in open data and transparency such as the European Union, that do not publicly publish cadaster property data. In this post, we will focus on this case, presenting how we estimate population at a 100-meter grid level in Italy, where cadaster open data is not published. We have applied analog methodology in other countries such as Portugal or Greece.
1. Accessing and Downloading Population Census Data
The first step is an easy one: accessing and downloading the most recent census data available at the census tract level. Census tracts (or census sections) are small, relatively permanent statistical subdivisions of a county, municipality or equivalent entity, designed to be relatively homogeneous with respect to population size and, therefore, sociodemographics. This small size and relatively high homogeneity make configure the census tract as an acceptable small area unit for spatial analytics, but very often it is still too large.
The number of census sections, their size, and population vary across different countries in Europe. In general, census sections are geographical divisions used for conducting censuses and gathering demographic data. In countries like Germany and France, census sections are referred to as «census districts» and typically have an average size ranging from 1,000 to 3,000 inhabitants. In Spain, census sections usually have a mean size of around 1,000 to 2,000 inhabitants. These sections are created considering criteria such as territorial homogeneity and population density.
The census data typically includes information such as population counts, demographic attributes, and sometimes dwelling unit counts for each tract. This data serves as the baseline for estimating the population at the 100-meter geographical grid level.
In Italy, census sections, known as «sezioni di censimento,» are quite small geographic areas used for data collection and demographic analysis. These tracts vary in size and population. There are around 400.000 census tracts, for 60.5M inhabitants, which results in 150 people per census tract in average. Average, that beatiful but non existing value indicator…

Quite small areas, but when we look at the map we realize there are some large census sections with large area and very small population, as their land use es agricultural or landscape.
2. Creating a Building Layer
The population in each census sections live in the buildings that are within the section. In a country like Italy, where no Cadaster data is open, we need alternative sources of building data. To create a building layer for the area of interest, OpenStreetMap (OSM) data and machine learning (ML) image analysis projects can be utilized. OSM is a collaborative mapping project that provides free and editable map data. By extracting building footprints from OSM, we can obtain a comprehensive representation of buildings within the area.
Additionally, ML image analysis projects, such as those utilizing satellite or aerial imagery, are a key source in identifying and mapping buildings accurately, as the main limitation of OSM as a sistematical analysis data souce is its lack of consistency: being yet a crowdsource maping project, some areas are very well mapped and have fairly good coverage, while other areas are very poorly mapped. This results in error that are not easily detected. And this is why other empirical, mor systematically generated sources are needed.

3. Estimating Dwellings per Building
Once we have a proper map of buildings, we need to know in which buildings people actually live, as many buildings are used as industrial, health, public services, terciary, non residencial purposes. To estimate the number of dwellings per building, we use train a machine learning model in Spain, where we have both cadaster dwelling data and a bunch of other fine granularity geodata we use to predict the presence of actual dwellings, such as commercial equipment, features of the street links, sociodemographic and urban tipologies… Once the model trained with Spain data performs sufficiently, we can apply it to Italy and any other country.

4. Assigning Population to Buildings
With the estimated number of dwellings per building, we can proceed to assign the population of each census tract to the buildings. This step involves distributing the population in a proportional manner based on the dwelling estimations. For example, if a census tract has a total population of 1,000 and the estimated number of dwellings within that tract is 200, we can assign 5 individuals to each dwelling, assuming an equal distribution. This process is performed for each census tract, ensuring that the overall population remains consistent with the census data.
5. Aggregation population into small areas
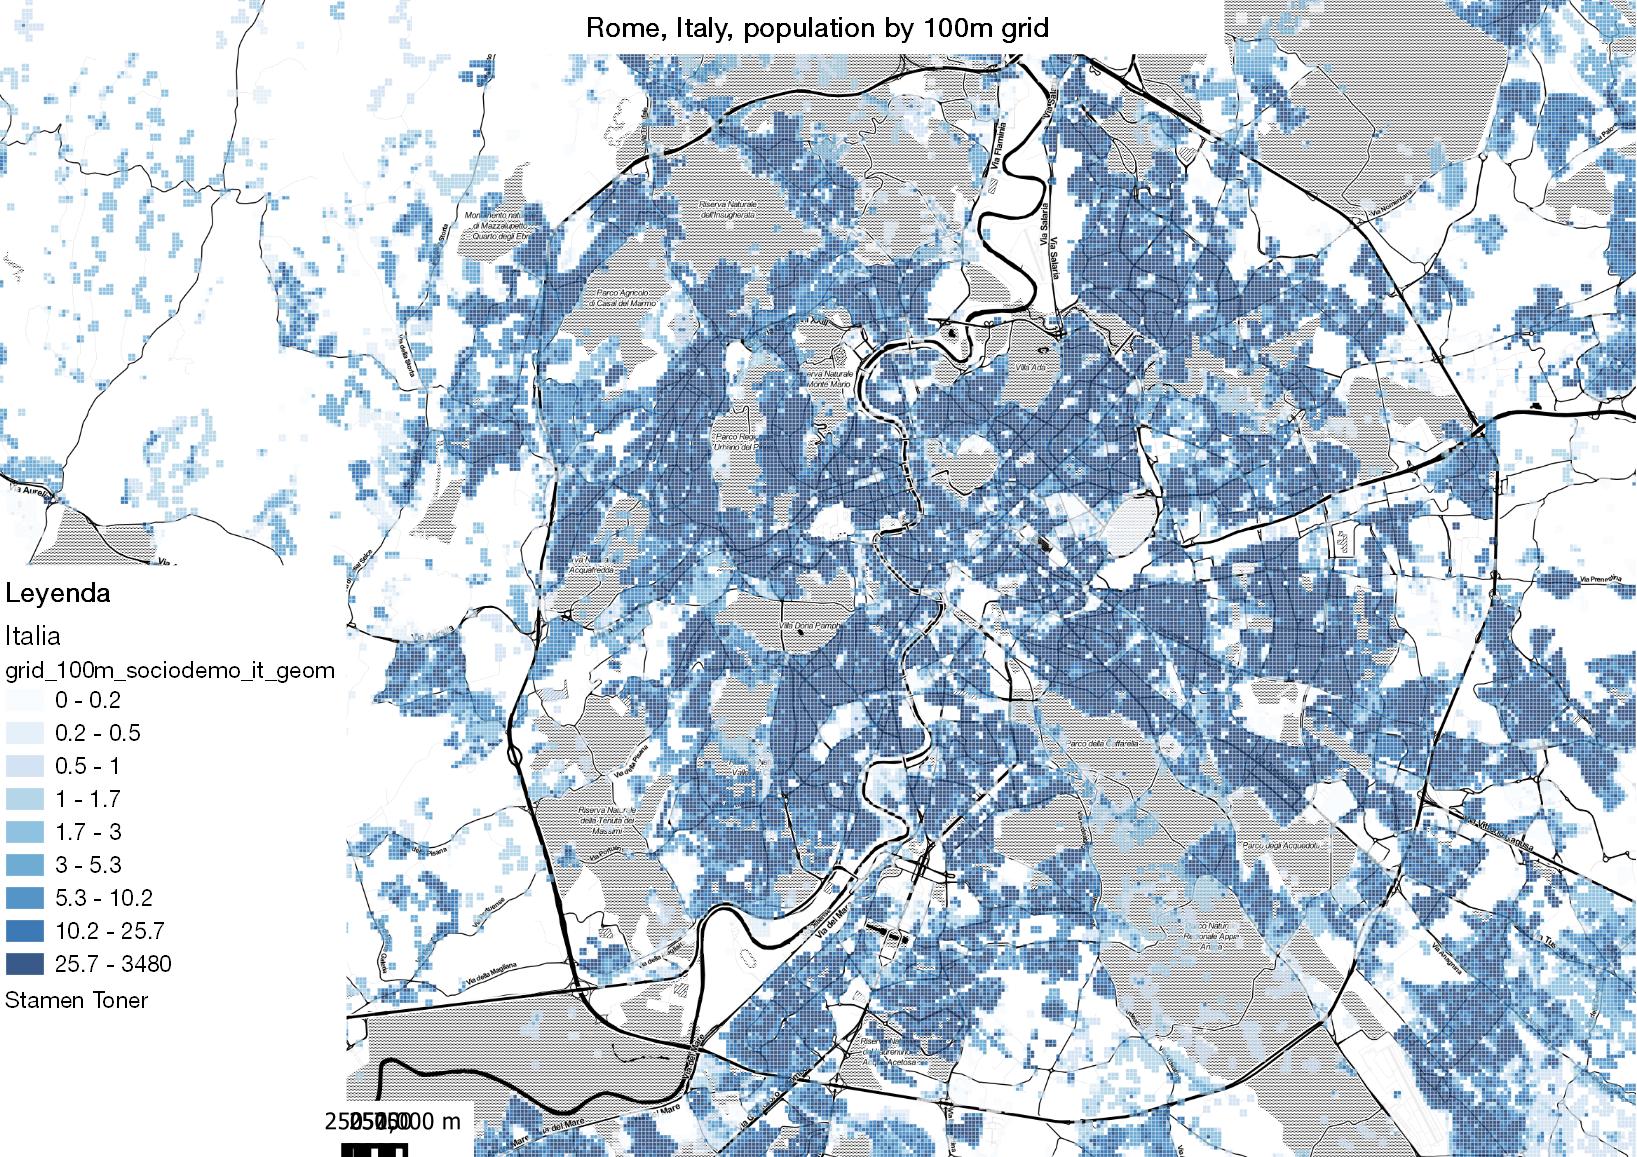
Once we have been able to assign population to every building / dwelling, it is easy to aggregate the buildings into a 100-meter grid, or any other regular, area constant grid such as H3 hexagons.
By completing these steps, we can estimate the population at a 100-meter geographical grid level. However, it is important to note that this estimation process comes with certain limitations and considerations. The accuracy of the estimation relies on the quality of the census data, the completeness and accuracy of the building layer, the reliability of the dwelling estimation algorithms, and the assumptions made during the population assignment process. Additionally, factors such as population mobility, changes in building usage, and new construction can introduce further complexities.

In conclusion, estimating population at a 100-meter geographical grid level involves accessing and utilizing census data, creating a building layer through OSM and ML image analysis, estimating the number of dwellings per building using algorithms trained in Spain, and assigning the population of each census tract to the buildings based on the dwelling estimations. While this process provides a valuable approximation of population distribution, it is essential to consider its limitations and refine the methodology based on specific local factors and data availability.
Guillermo Córdoba
Latest posts by Guillermo Córdoba (see all)
- Enriqueciendo datos para segmentar hoteles, caso práctico - 05-03-2024
- Caso de análisis de movilidad con telefonía móvil (II) - 27-09-2023
- Customer journey y análisis de clientes - 18-09-2023